HRSD Wastewater Surveillance
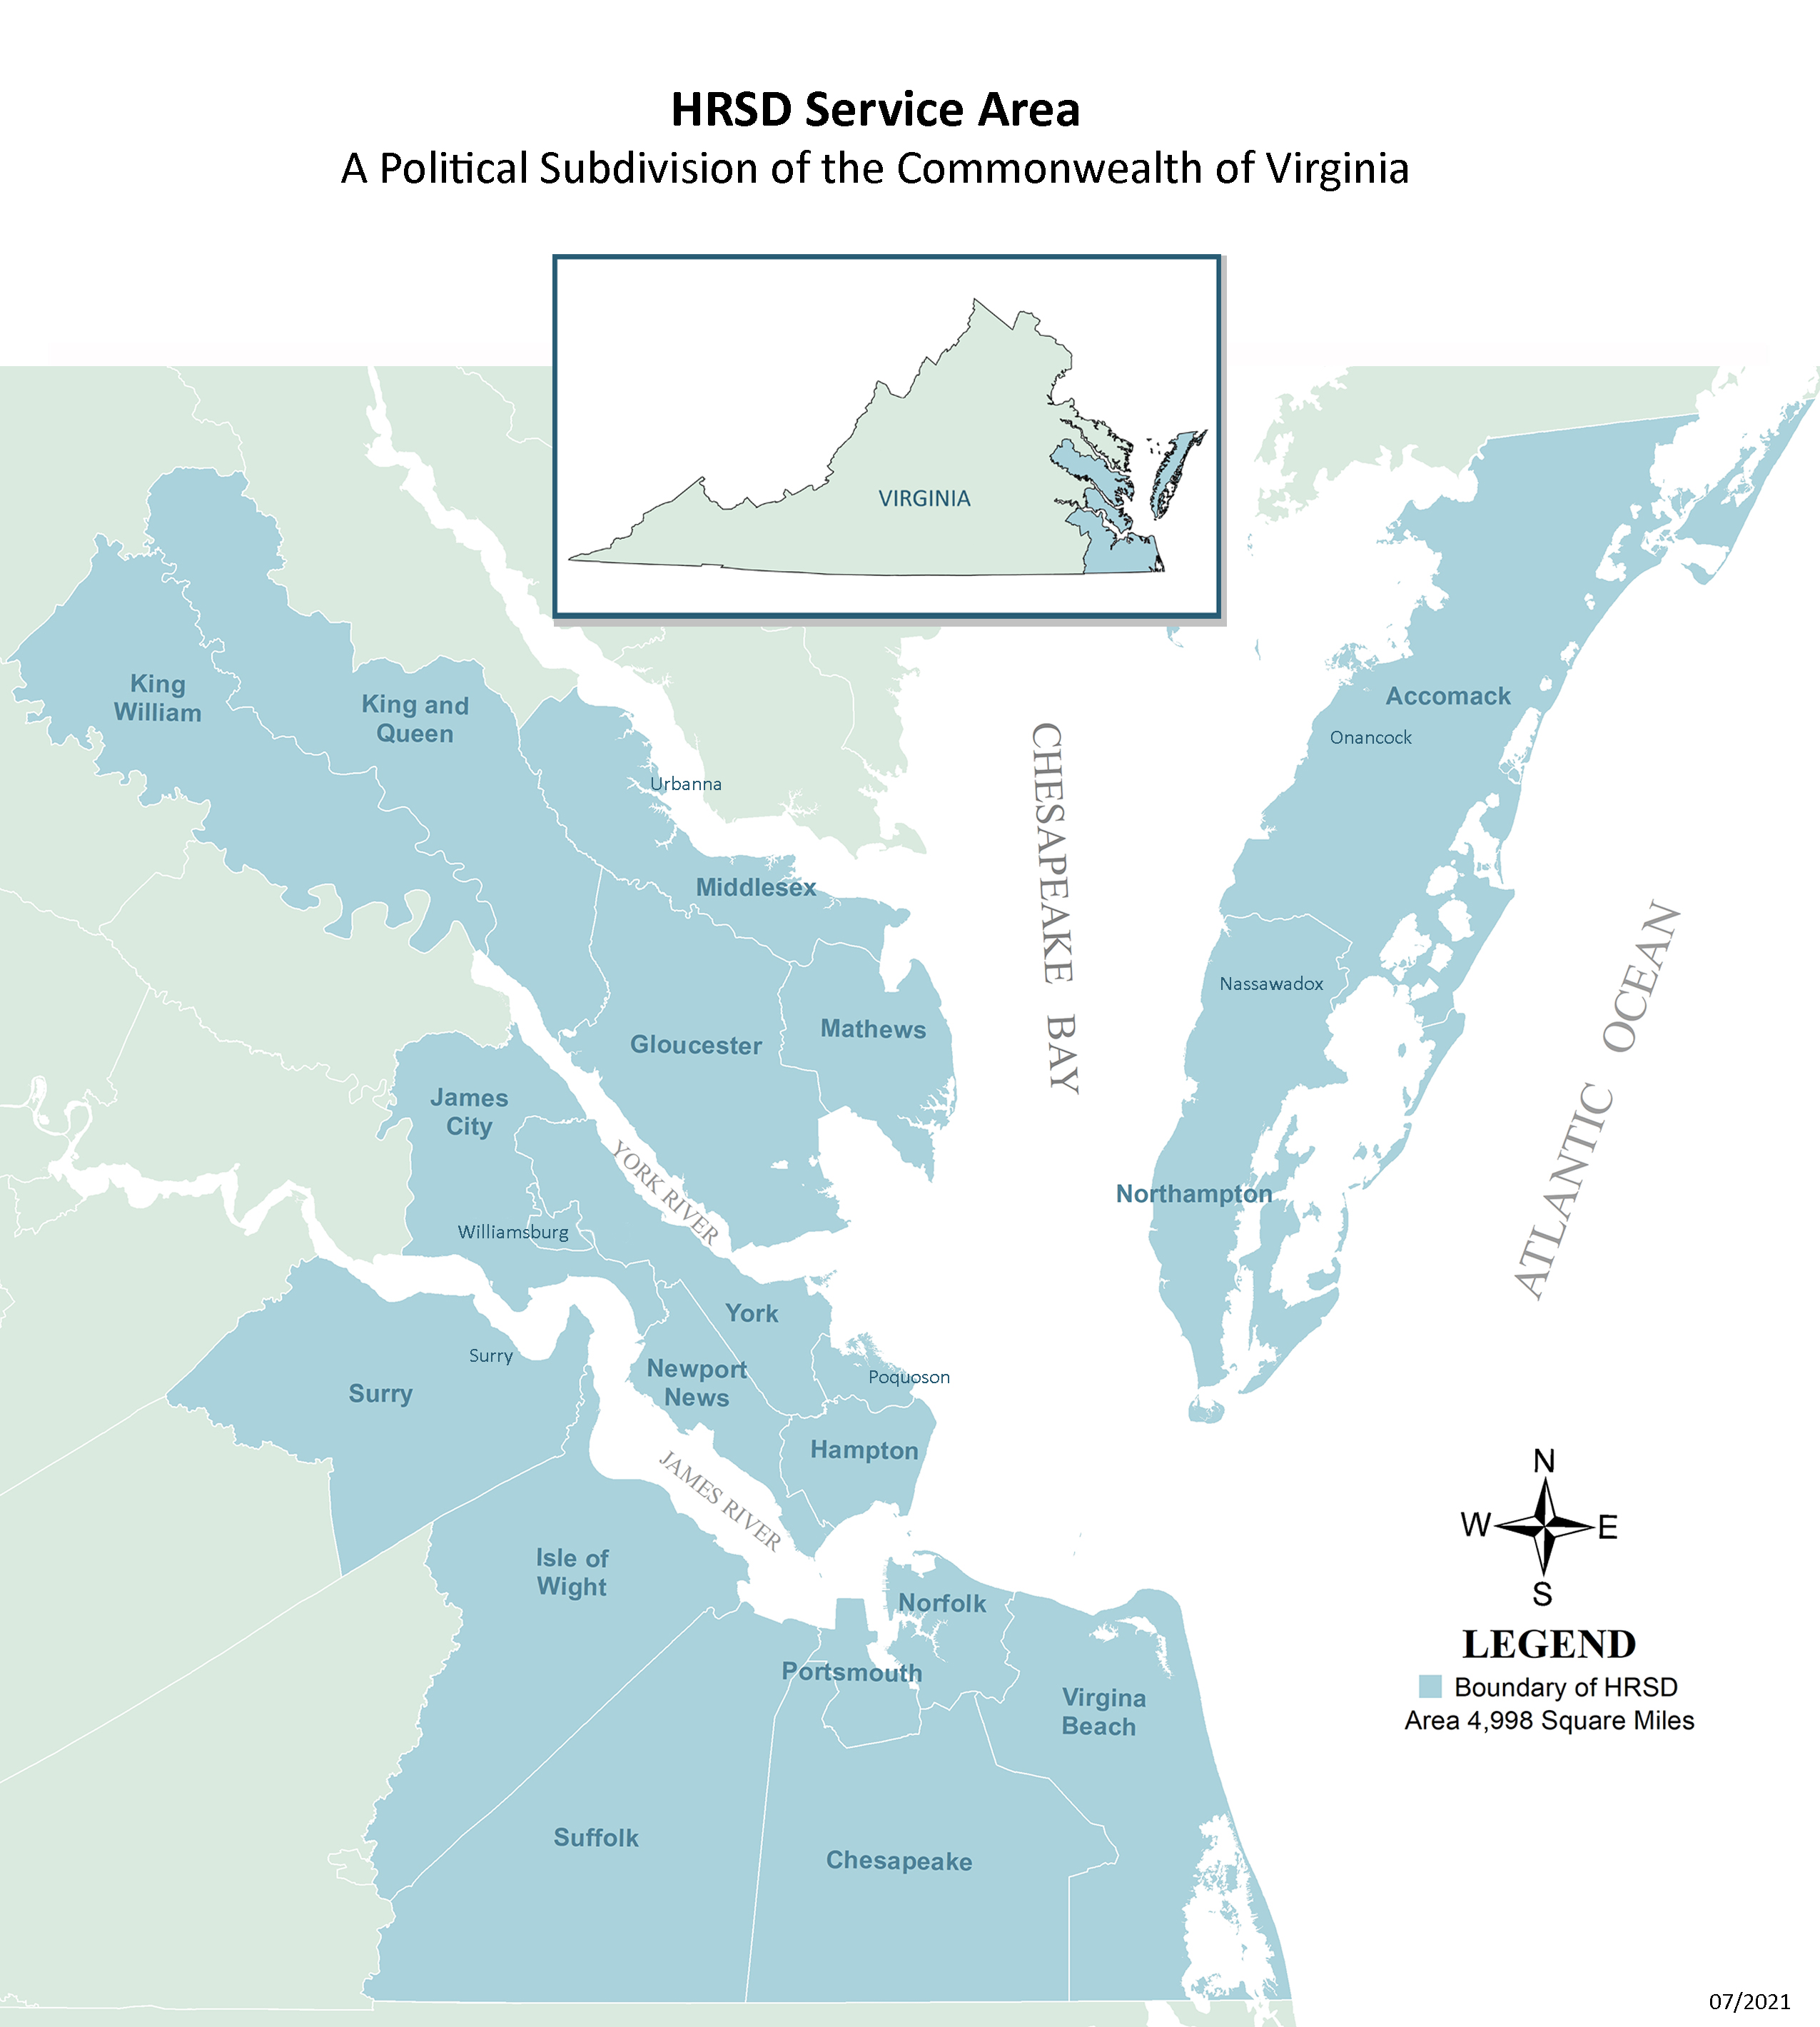
Service Area Map
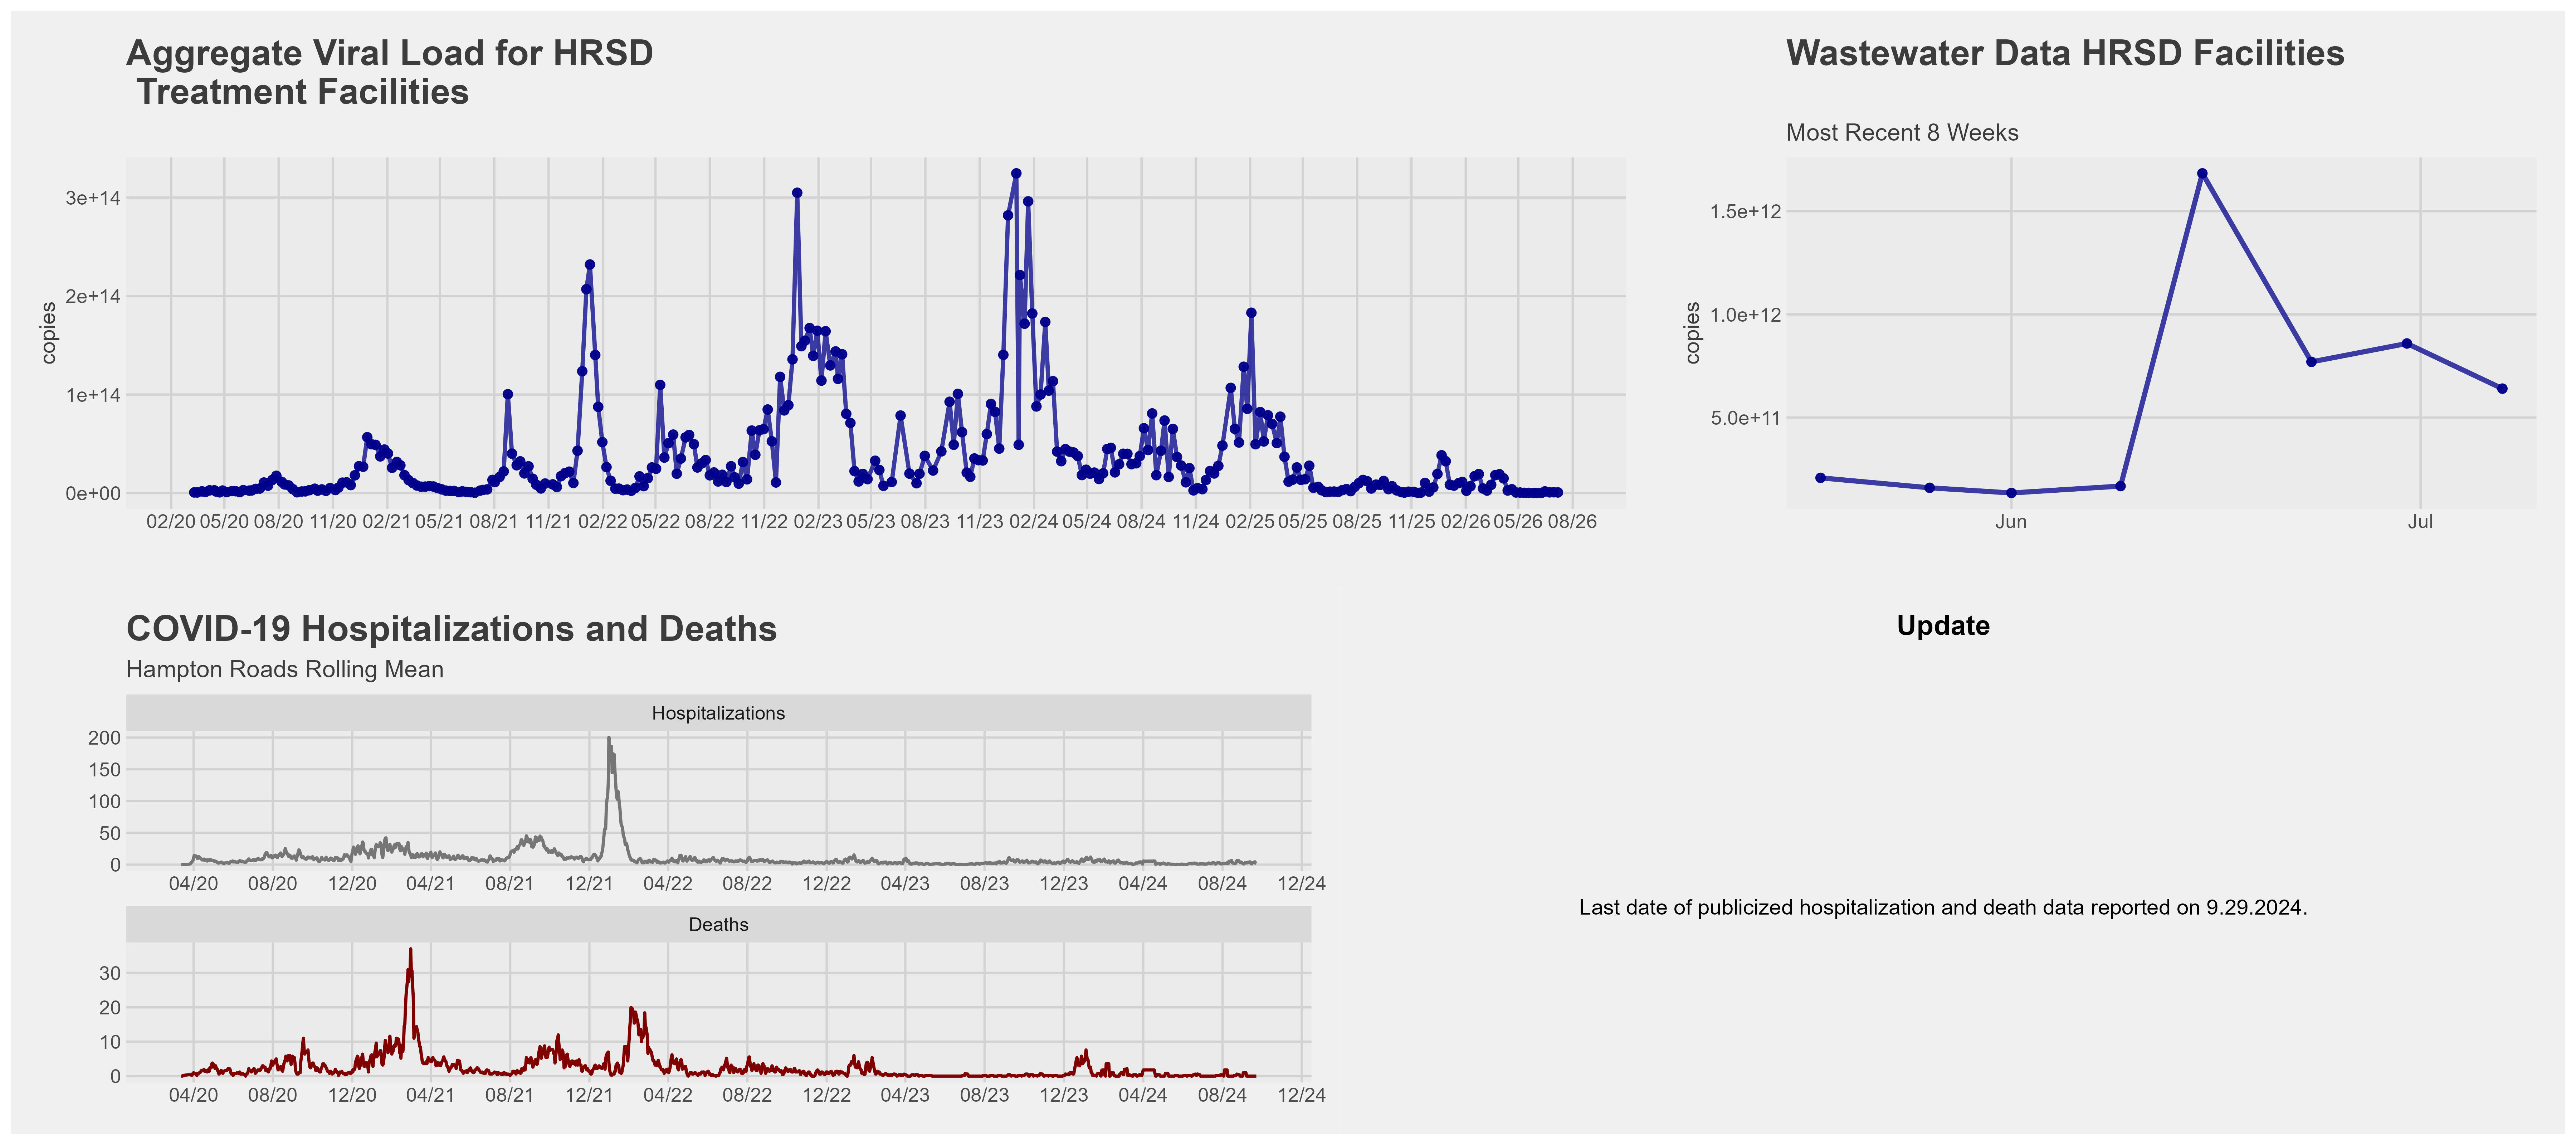
COVID-19 Time Series
Regional COVID-19 Loading
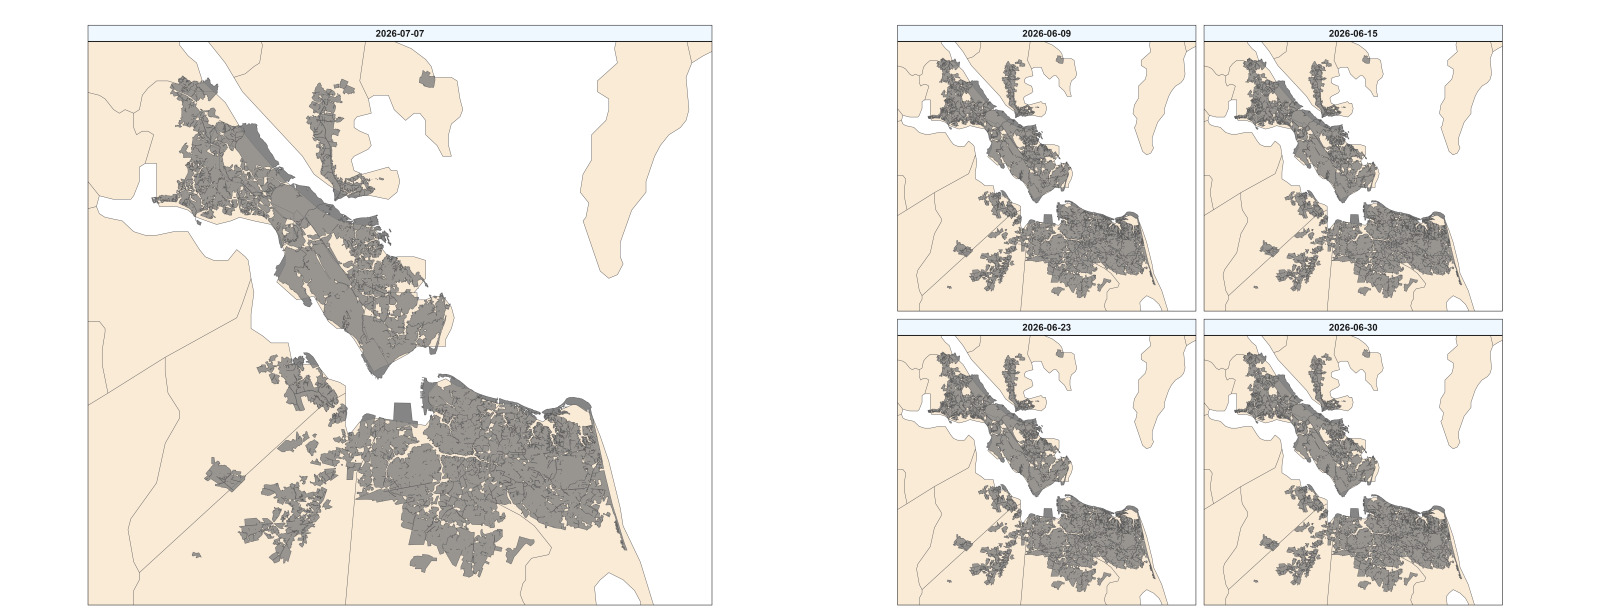
COVID-19 Heat Map
A Spatial Look at Normalized COVID-19 Loading
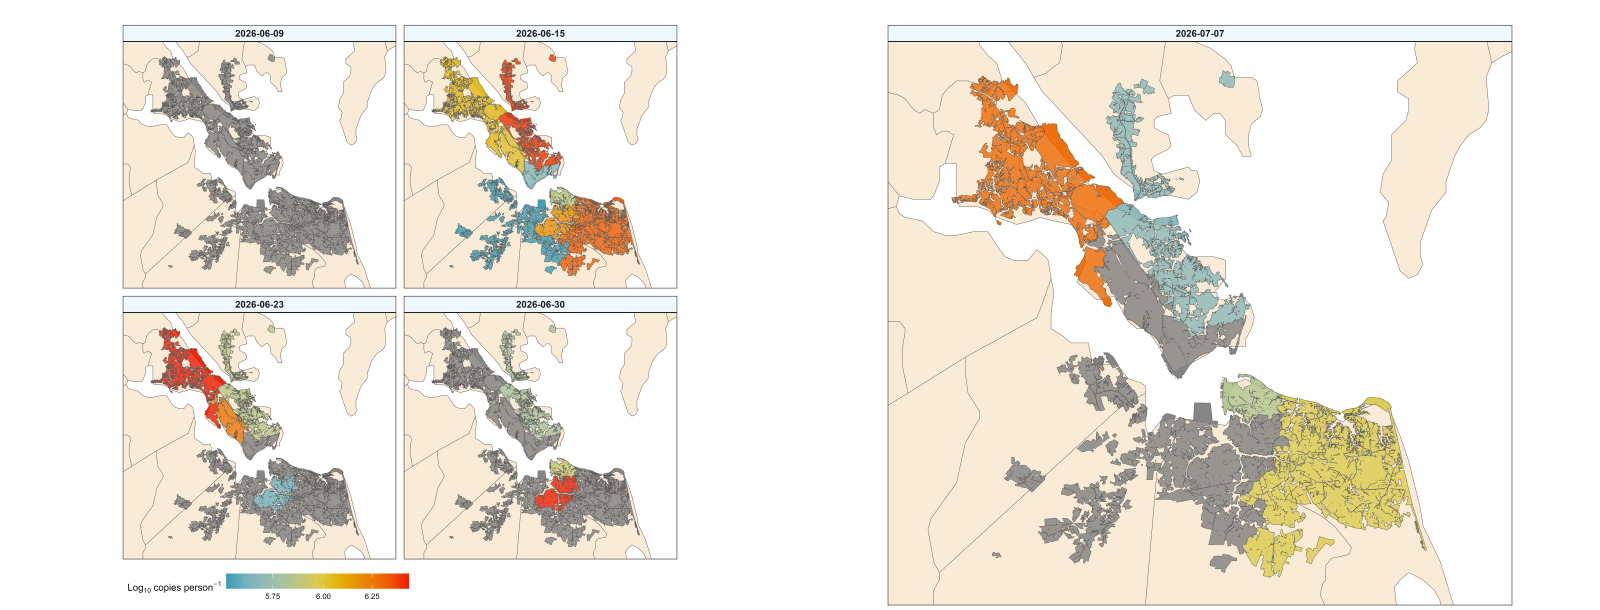
Most recent five weeks. Heat maps represent population normalized loading for facility catchments. Scale (log10 copies/person) is set based on most recent 4 weeks of data.
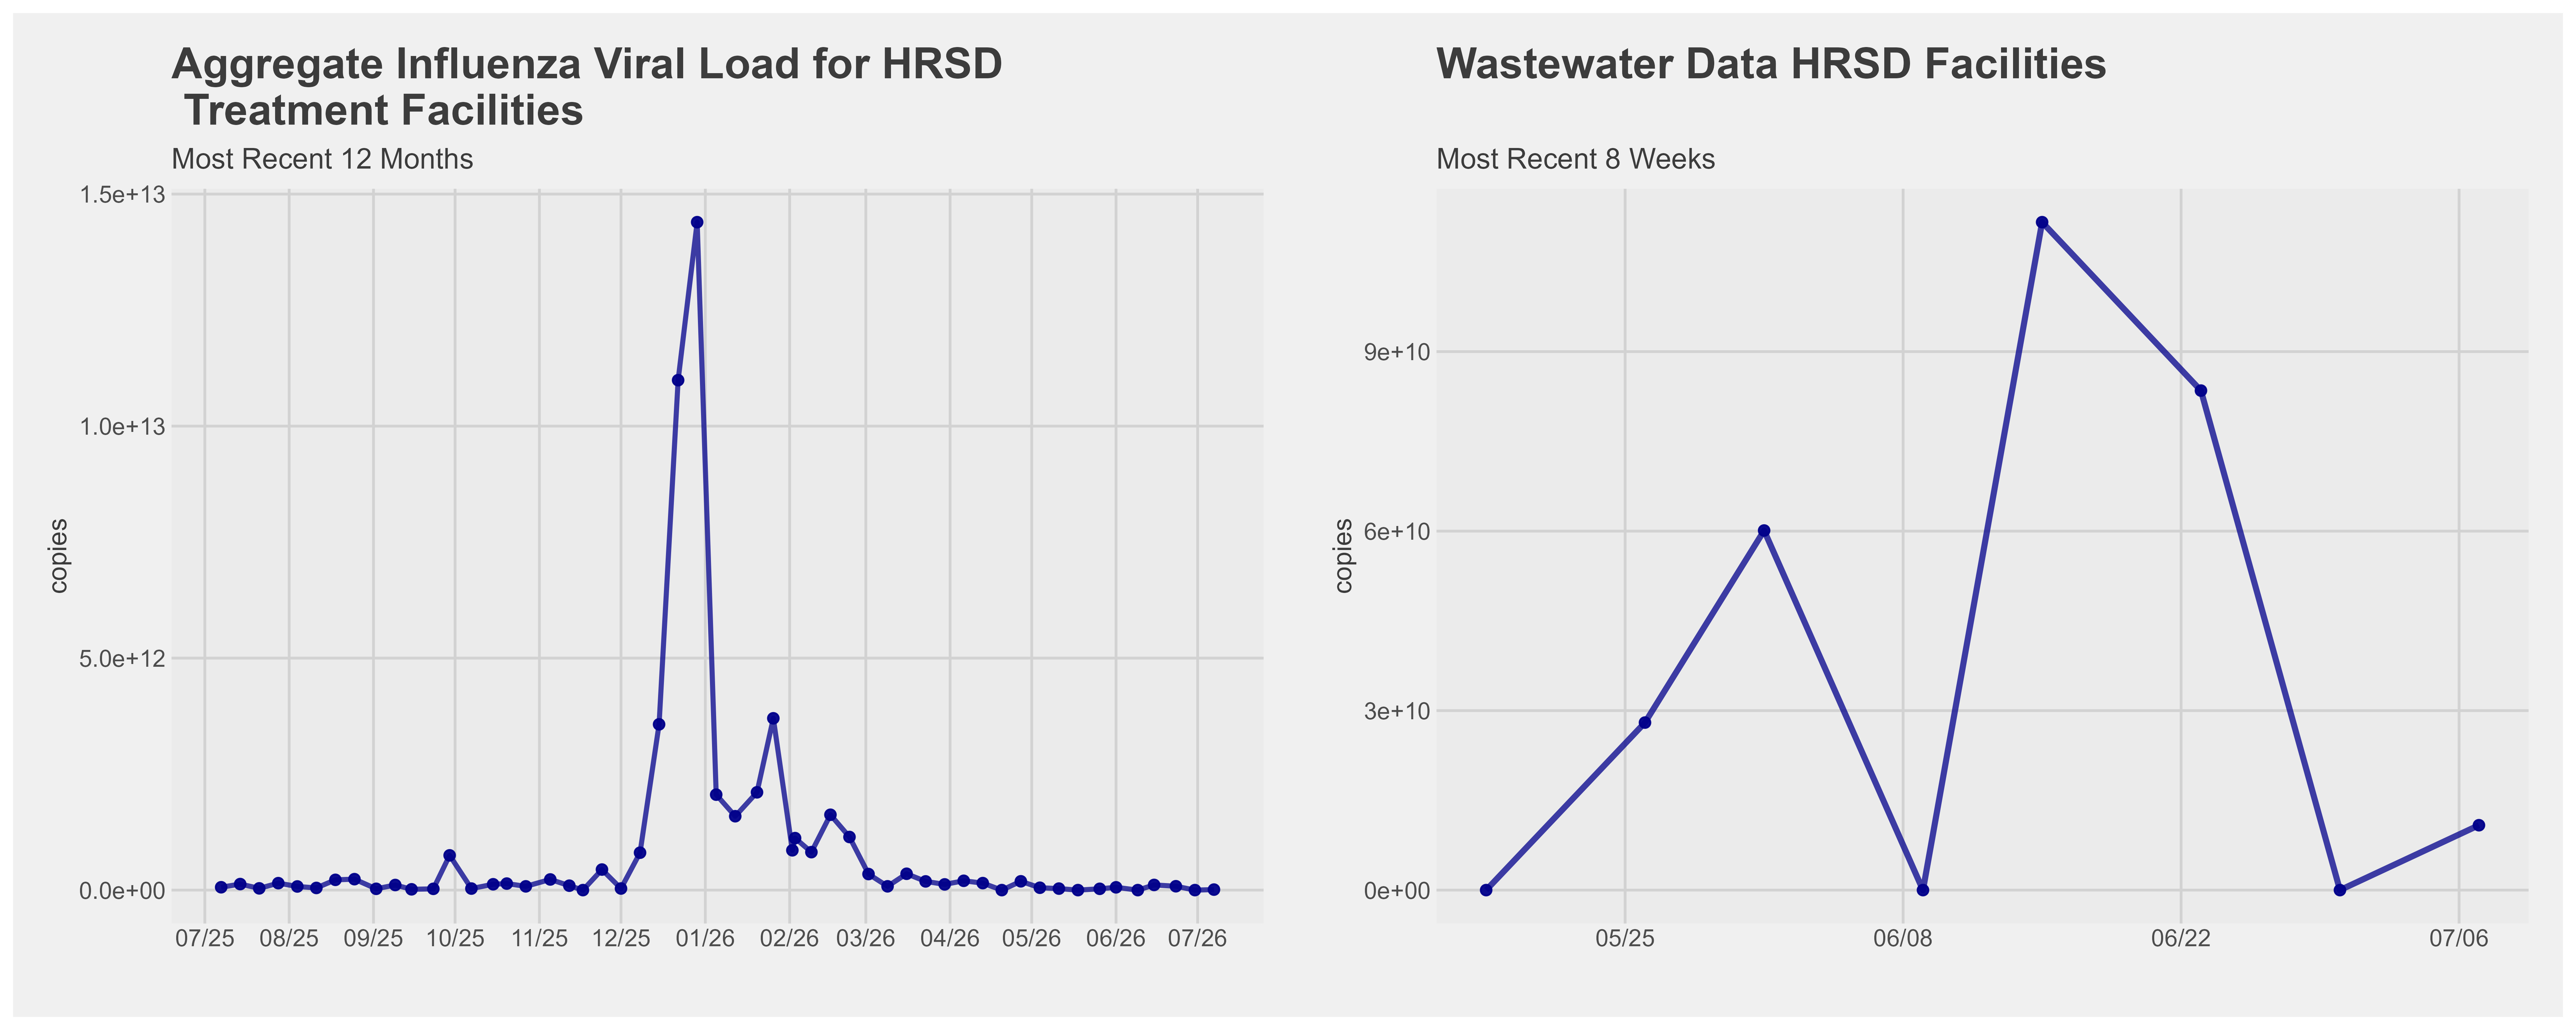
Influenza Time Series
Regional Influenza A Loading
Influenza Heat Map
A Spatial Look at Normalized Influenza A Loading
Most recent five weeks. Heat maps represent population normalized loading for facility catchments.